About -> Performance Tests
This page has been visited 8520 times.
A collection of performance tests and measurements performed on OpenSIPS 3.4, on various subsystems: database, transactions, dialogs, etc. These tests should give you a broad idea on what you could achieve on your own OpenSIPS setup using similar hardware!
1. Purpose
The objective of the stress tests was to re-assess the performance of various OpenSIPS subsystems, ahead of the upcoming 3.4 beta release. Apart from putting updated maximum capacity numbers on these modules, the tests also pinpointed various performance bottlenecks in each scenario, thanks to code profiling.
2. Overview
- the stress-tests were broken down into three categories: calling tests, B2B tests and TCP engine tests
- within each category, we gradually increased the amount of features (code) ran through by each test
- the upper limit of each test was determined by various metrics: either max CPU usage on the OpenSIPS box, various error logs at capacity limit or UDP/TCP accumulating Recv-Queue
- once the CPS limit was discovered -> perform profiling, analyze the CPU usage map and try to spot bottlenecks
2.1 Setup Description
- all tests used the F_MALLOC memory allocator (the default in all public builds). A performance comparison between F_MALLOC, Q_MALLOC and HP_MALLOC can be found in a separate set of tests below
- the CPU-bound tests (1-6) used a maximum of 8 UDP workers (typically 4), in order to minimize context-switching (since the OpenSIPS system was a quad-core -- 1:1 worker/CPU mapping)
- starting with test #7, the SIP workers were bumped to 8, to cope with the added I/O operations (8 workers were enough to satisfy the required ~6k CPS)
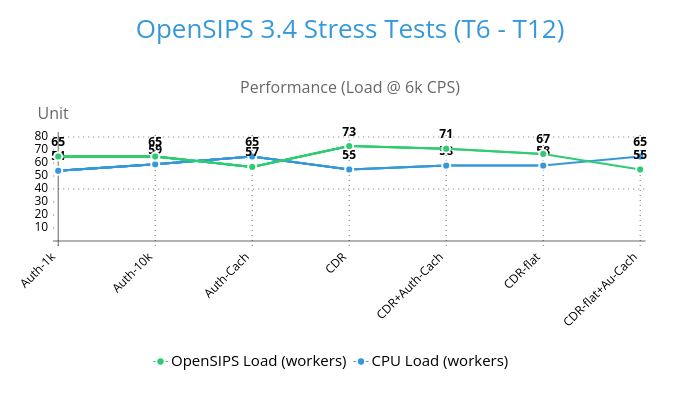
- in tests 1-6, the proxy was pushed to the maximum possible CPU load, while on tests 7-14 the traffic was kept constant at 6000 CPS and we instead monitored the CPU load penalty as we progressed through the tests
- average call duration: 30 seconds
- UDP was used as transport protocol for the majority of tests, unless stated otherwise
- latest git revision the tests were run on: b0068befd (May 9th, master branch)
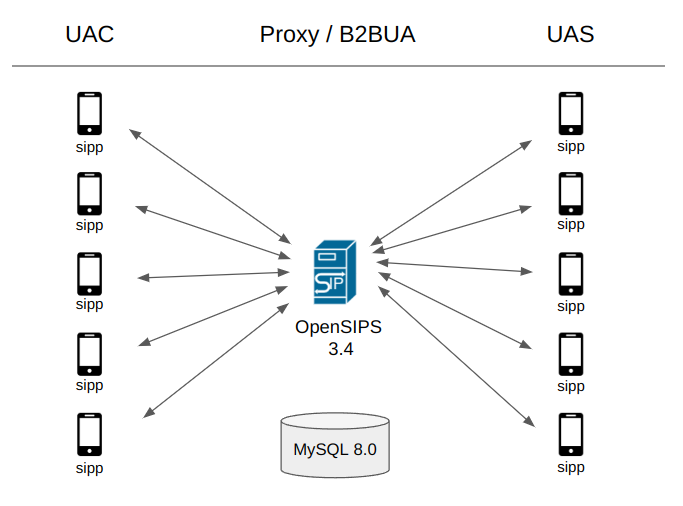
For all SIP traffic generation purposes, sipp was the main tool which got the job done. Being a single-threaded application, both the sipp UAC and UAS were found to reach their capacity limitation at around 2500 - 3000 CPS. So we simply scale them horizontally, by launching more clients and servers!
2.2 Hardware
- Intel(R) Core(TM) i7-7700 CPU @ 3.60GHz (4 cores, 8 threads, launch date: Q1'17)
- 16 GB DDR4 (Kingston)
- SSD 850 EVO 250GB (Samsung)
3. Raw Results
The following table shows the raw CPS data used in each scenario. Notes:
- the Avg. CPU column represents the average CPU usage of the SIP worker processes, as shown by top
- the Load-1m column represents the average OpenSIPS load over 1 minute of the SIP worker processes only, extracted from the load: statistic
3.1 Basic Calling Scenarios (transactions, dialogs)
Unauthenticated Calls
| Test ID | Description | CPS | Avg. CPU | Load-1m | Avg. IN/OUT Traffic | Profiling | Notes |
|---|
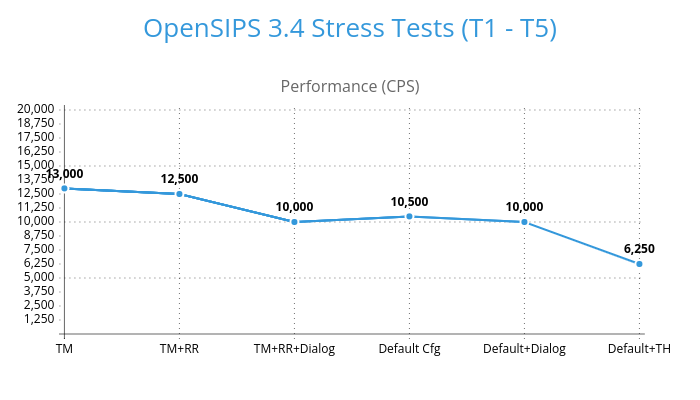
| 1 | TM | 13000 | 77% | 80% | 43 MB/s | PDF |
| 2 | 1 + RR | 12500 | 83% | 84% | 42 MB/s | PDF |
| 3 | 2 + DIALOG | 10000 | 95% | 94% | 36 MB/s | PDF |
| 4 | DEF. Script | 10500 | 82% | 64% | 36 MB/s | PDF |
| 5.1 | 4 + DIALOG | 10000 | 86% | 73% | 36 MB/s | PDF |
| 5.2 | 5.1 + TH(Call-ID) | 6250 | 91% | 88% | 20 MB/s | PDF |
Authenticated Calls
| Test ID | Description | CPS | Avg. CPU | Load-1m | Avg. IN/OUT Traffic | Profiling | Notes |
|---|
| 6 | 5.1 + AUTH 1k | 6000 | 54% | 65% | 26 MB/s | PDF | MySQL 60%+ CPU usage |
| 7 | 5.1 + AUTH 10k | 6000 | 59% | 65% | 26 MB/s | PDF | MySQL 65%+ CPU usage |
| 8 | 7 + Auth-Caching | 6000 | 65% | 57% | 26 MB/s | PDF | MySQL 0% CPU usage |
| 9 | 7 + CDR | 6000 | 55% | 73% | 26 MB/s | PDF | MySQL 110%+ CPU usage |
| 10 | 9 + Auth-Caching | 6000 | 58% | 71% | 26 MB/s | PDF | MySQL 70%+ CPU usage |
| 11 | 7 + CDR-flat | 6000 | 58% | 67% | 26 MB/s | PDF | MySQL 70%+ CPU usage |
| 12 | 11 + Auth-Caching | 6000 | 65% | 55% | 26 MB/s | PDF | MySQL 0% CPU usage |
3.2 Complex Calling Scenarios (B2B)
| Test ID | Description | CPS | Avg. CPU | Load-1m | Avg. IN/OUT Traffic | Profiling |
|---|
| 13.1 | B2B - TH | 1200 | 64% | 60% | 8 MB/s | PDF |
| 13.2 | B2B - REFER | 1000 | 66% | 61% | 6 MB/s | PDF |
| 13.3 | B2B - Marketing | 900 | 68% | 63% | 5 MB/s | PDF |
3.3 TCP Test Scenarios
| Test ID | Description | CPS | Avg. CPU | Load-1m | Avg. IN/OUT Traffic | Profiling | Notes |
|---|
| 14.1 | TM-Con-1-Read-0 | 12500 | 66% | 58% | 42 MB/s | PDF | Test start: conn balancing |
| 14.2 | TM-Con-1-Read-1 | - | - | - | - | PDF | Note: conn READ bug at high volumes, WIP |
| 14.3 | TM-Con-1-Read-2 | - | - | - | - | PDF | Note: conn READ bug at high volumes, WIP |
| 14.4 | TM-Con-N-Read-0 | 4000 | 52% | 20% | 12 MB/s | PDF |
| 14.5 | TM-Con-N-Read-1 | - | - | - | - | PDF | Note: conn READ bug at high volumes, WIP |
| 14.6 | TM-Con-N-Read-2 | - | - | - | - | PDF | Note: conn READ bug at high volumes, WIP |
4. Conclusions
- the newly introduced load: statistic is critical for monitoring the behavior and performance of your OpenSIPS instance. It can help you spot which workers are busy or not. Or when you need extra capacity on your instance, due to being either CPU-bound or I/O-bound.
- recap: this statistic monitors the "idleness" of your OpenSIPS workers. If they are doing anything other than waiting for a new SIP job, then they are "busy". Otherwise, they are "idle". For example, if an OpenSIPS worker is running a sleep(1000) in your opensips.cfg, its load: value will be 100% (fully busy).
- a low CPU usage from your OpenSIPS instance does not mean it's necessarily not loaded. It could be stuck in I/O operations and asking for more SIP workers.
- when adding DB query caching to your OpenSIPS instance, do not be surprised if it's running a higher CPU usage, because the database will be at 0% CPU usage afterwards, resulting in a overall net gain of CPU resource, as well as dramatically reduced I/O wait time (again, watch the load: statistic).
- the B2B modules currently have a lower CPS performance, due to the internal complexity of the code. We are still evaluating whether there is room for optimization in the current shape of the codebase.
- the new OpenSIPS TCP connection balancing is based on the load: statistic, so when doing TCP engine stress-testing in single-connection mode (on the clients' side), make sure to start the UACs gradually, one-by-one in order to give the load: statistic a bit of time to update, such that the new high-throughput connections do not all end up in the same TCP worker!


