|
About |
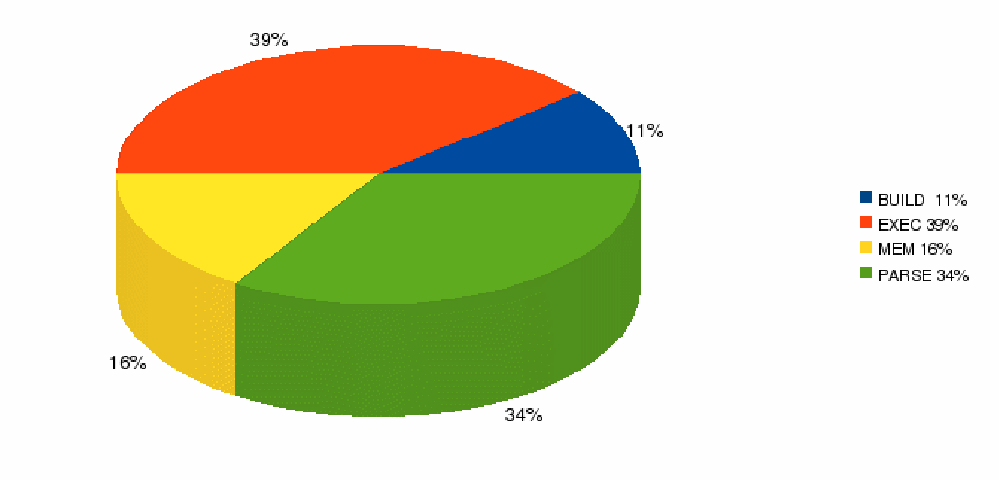
About -> Performance Tests -> Code profiling on OpenSIPS 1.6Why profilingWe decided to run some profiling on the code of OpenSIPS 1.6, to learn (and not estimate and guess) which are the most CPU consuming parts of OpenSIPS at this moment - in other words, what is the most expensive task (like parsing, running script, etc) performed by OpenSIPS when it comes to CPU usage. Note that with profiling you learn only the CPU usage and not also the I/O dead times - the profiling is actually taking place only when the OpenSIPS processes do own the processor; while they are suspended in I/O's, no profiling is done, so the I/O dead times will not be reflected in the profiling results. The profiling is about pure CPU usage. Profiling scenarioThe profiling was done having OpenSIPS proxy as an intermediary between a SIPp server and a SIPp client (using standard UAC-UAS scenarios). OpenSIPS was running in no fork mode (only one worker process) and for configuration the default config file was used. The only change in the config was to enable dialog support (via create_dialog() for initial INVITEs). Profiling was done with the gprof profiling tool for 10 million calls with a rate of 2000 simultaneous calls. ResultsThe detailed results of the test are available either in a text format or displayed in the chart bellow,
ConclusionsIf you look only from the CPU usage perspective, you can see that managing the SIP messages (parsing and building) takes almost half of the CPU usage for OpenSIPS. This information is actually useful for both developers and script writers to understand what is the impact of the functions they implement or use - abusing functions that do trigger parsing or not repeating the same parsing ops several times in different parts of the script. |

